
Well, a beautiful mirror pattern in the daily time frame on the S&P 500 has evolved. If it’s going to be resolved tomorrow, Monday, the S&P 500 should downright march off again. Once more new all-time highs would be the inevitable result besides – probably - reaching the now favored GUNNER24 Exhaustion Targets at 1889 till end of January 2014.
But before we get to this true showpiece of repeated mass phenomena, let’s first have a look to the general situation of the market.
Last week was volatile and mercurial. There were downs, ups, an all-time high, and the last two days the market consolidated the new ATH.
Reason for the jumps into one direction or the other is the pre-set vacuum that frequently shows when markets trade within the lines of a double arc. As it were, a little battle bulls against bears is taking place where the forces often keep balance because both of them strongly tug each other. The bears are making out the end of the bull already, daring first, thoroughly powerful, short-attacks because they think that the trend has already got to change now.
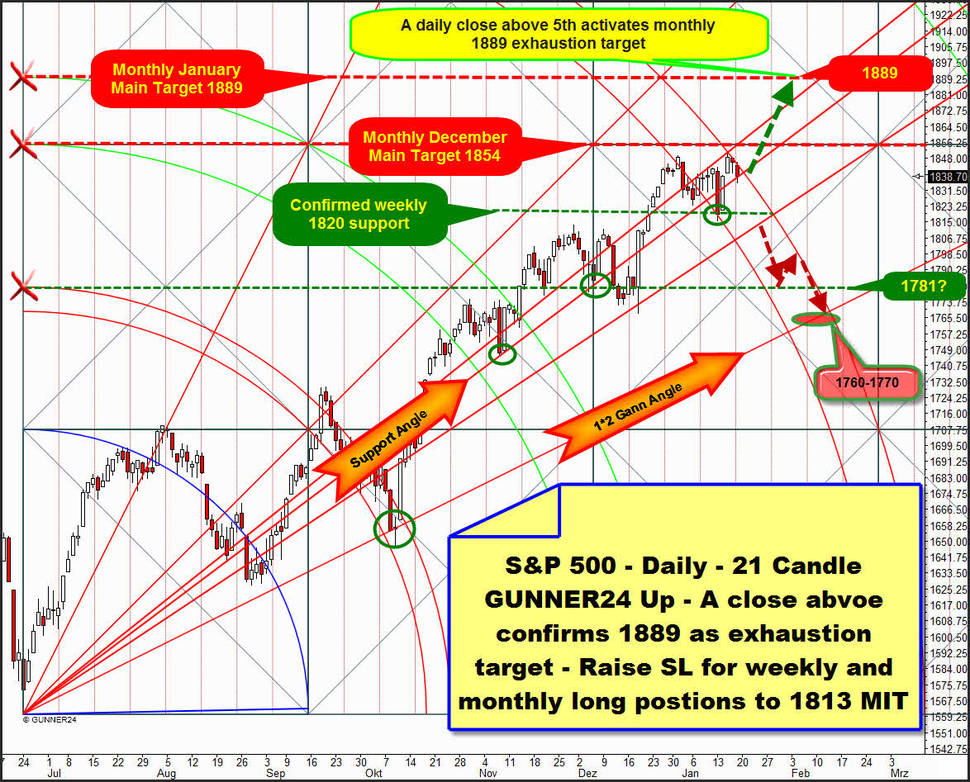
By the hefty Monday short-attack the week tested the weekly 1820 GUNNER24 Horizontal Support successfully. As postulated in the last issue, it will take 2 consecutive closings below this extremely important bull-market support to turn the trend. Since Monday intraday tested the 1820 support – certainly pretty deeply – by the 1815.52 low, closing the same Monday with 1819.20 but very narrowly and in any case not significantly below 1820, furthermore Tuesday re-conquered the 1820 unmerciful and Wednesday bringing a new ATH, now the 1820 weekly horizontal support is the confirmed make-or-break mark. Another daily close beneath should be the confirmation for the bull-run to be slowed down and thwarted for several months. The provident traders just get themselves a sell-stop G.T.C. order at 1815-1813 because a confirmed slipping below 1820 will be likely to lead to a quick sell-off to under 1800 – no matter when this move will be due…
We raise our SL for the weekly and monthly long-positions to 1813 MIT, closely beneath the lows of 01/13 (Watch regulary the GUNNER24 Stock Markets performance table here).
If the 1820 breaks downwards the next 5 days, the 1781 at the next lower daily horizontal support – this one starts from the intersection point of the upper line of the first with the beginning of the setup - will keep on remaining as the first important potential low and the main target in the 1760-1770 area at the 1*2 Support Gann Angle as target till middle of February 2014.
But the uptrend hasn’t finished yet. I expect it to reach the 1889 by the end of January, then turning.
Trigger for the run to the 1889 will be the final break of the upper line of the 3rd double arc!
The next daily close above the upper line of the 3rd is another significant buy signal. It will finally activate the 1889 uptarget. Please mind the dotted green up-arrow in the daily setup above! The final break of the 3rd is very imminent!!
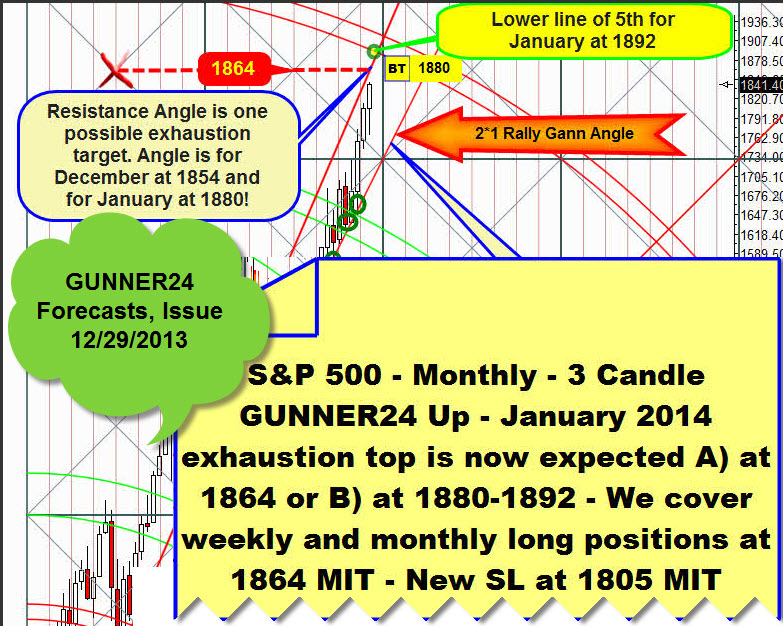
With respect to the potential January 2014 exhaustion targets, in the end there keeps being the analysis in detail on the exhaustion targets of 12/29/2013 that I may remind of optically again:
As matters stand today, analytically the following is to be recorded:
The possible 3 exhaustion targets are:
A) The 1854. This is where the market may finally turn. But I believe that with only a 5-10% of probability. It was a monthly exhaustion target for December 2014. Certainly the 1854 is an important monthly resistance being supposed to be paid attention to in January 2014 as well… That means, perhaps a 2-3 day consolidation/small 10-12 point pullback will take place after the S&P 500 will have reached the 1854, but there won’t be more. Though for me is certain that the market shall be slowed down there because the 1854 in the daily 21 candle up presented very upmost is also a natural horizontal daily resistance.
B) The 1864. The probability of the market to turn there is at a 30-40%. There, at 1864, a monthly horizontal resistance is taking its course. It’s a serious, a really serious monthly resistance being able at any rate to develop enough rejection energy to bring the S&P 500 to its knees.
That’s why we keep on covering our weekly and monthly long-positions at 1864 MIT, as notified on 12/29/2013.
C) The 1880-1892. Concretely it’s the 1889, just worked out a little more precisely, since this resistance, too, represents a visible horizontal resistance in the daily 21 Candle GUNNER24 Up Setup above. Together with the lower line of the 4th in the monthly 3 Candle GUNNER24 Up Setup being at 1892 index points for January 2014, thus the 1889 is showing the very strongest GUNNER24 Magnet Function thereby being the most preferred January 2014 exhaustion target now. Thus the probability of the 1889 to be touched as early as in January 2014 is at about a 50%!!
The daily mirror pattern
The gentle reader and chartist may ask himself at this position and this moment: What the hell is that guy making out there?!? Well, please get concentrated yourself in the daily 21 candle up setup upmost, first to the action and the pattern within the lines of the 2nd double arc (end of October/beginning of November 2013) comparing them with the current action of the last days and the therefore arisen chart patterns within both lines of the 3rd double arc…
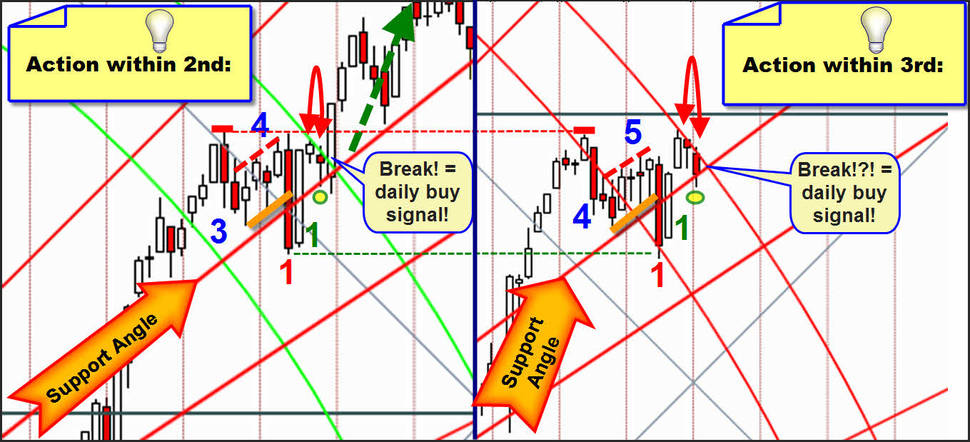
They are as like as two peas. At first a swing high is forming. This one is retraced. Once it lasted 3 days, lately 4 days. Then an upwards sloping bearish channel is evolving. At the green 2nd it is formed during 4 days, now in January one day more, so it’s 5.
It’s followed by the long sell-candle – Big Red 1 – that is mightily retraced the next day = Big Green 1. Interesting and extremely illuminating is also the same performance by the Support Angle at the Big Red 1 and the Big Green 1.
In each case the Support Angle is broken downwards, brutally and significantly. But it is re-conquered one day later. The Gann Angle Sell Signal = Big Red 1 is countered by the Big Green 1, the respective angle sell signal is countered by an angle buy signal = a classical false break action where the bulls are shaken out by lower lows before it goes up again. The trend continuation is guaranteed!
Then the respective resistance line of the double line is reached. Afterwards, at the green 2nd, the S&P 500 consolidates exactly for 2 days at the upper line resistance with relatively small candles that are showing lower highs and lower lows thus following the downwards course of the upper line of the 2nd double arc.
Now come 3 days with the same small candle/high/low/resistance performance. Again it arguably lasts a day longer. In each case, also the Support Angle supports the 2nd or the 3rd day of the retracement from the upper lines.
If now the market wants to keep on joining this mirror pattern EXACTLY it will have to make a small lower low again or perhaps a double low tomorrow, on Monday, then in the course of the day mightily careering upwards, in the further course breaking finally the upper line of the 3rd and thus confirming again the chase to the 1889. If tomorrow it wants to continue joining the mirror pattern exactly, it would have to close at the daily highs, in fact at rather precisely 1854, the next higher combined monthly and daily Gann Magnet.
Whether the mirror pattern will be solved upwards tomorrow just as described and presumed, should be at least as thrilling as both NFL Conference Finals today, I suppose!?!
|

„As far as I know", the GUNNER24 Forecasting Method is the globally unique and only technical analysis tool that deals intensely with the comportment of the market at support and resistance marks being able to combine that with price predictions. You’ll learn everything on these really "secret" facts in the Complete GUNNER24 Forecasting and Trading Course. Order now!

Be prepared!
Eduard Altmann