
Today, some pretty important things are to be reported again: The first GUNNER24 Forecast on the current stock market correction regarding the duration of this correction, its presumed structure as well as the resulting turning points resp. downtargets.
Today’s GUNNER24 Analysis is based on the monthly charts of the E-mini S&P 500 (ES) future, the Dow Jones (YM) E-mini future together with the DAX future (FDAX).
As an exception, the present fundamental analysis of the current correction is not based on the respective indexes. There is a reason for that: As a rule, important changes, targets and signals in terms of time and price can always (Yessir, yet nowadays) best be identified in the corresponding future markets, since these ones are being traded for nearly 24 hours a day, thereby containing all the swings emerging in the past according to the factors time and price and sentiment = emotions.
Moreover, it’s the really big money, the Big Boys that trade the future markets that again regulate the pricing of the corresponding indexes. So, where the money investment resp. the bet is the highest, also the emotional extrema should have to be the most revealing as far as future developments and expectations are concerned.
Let’s start with the weakest in revenue of the three mentioned future markets, the FDAX. It’s important for Europe, but compared with the really global ES or YM future markets, it’s rather a "transregional" scene.
Nevertheless – well, you may know my opinion about this index – the DAX/FDAX together with its congenial fellow, the NASDAQ-100 index, very often resp. nearly always unveil the true nature and the future intentions of the stock markets.
After all, the NASDAQ-100 shed light on the moment when this correction is going to really get started. The January announcer "THIS IS THE END + The music is over now" you’ll find here again for reading up.
Besides, the FDAX seems to be showing us the way where and when this correction is supposed to end – I think/hope so… For all the three mentioned markets, we put on the downtrend glasses today applying a GUNNER24 Down Setup at the all-time high (ATH) of the year 2015.
Important is in this context that in all three futures the down setup measures from the corresponding ATH to the respective low of the 5th candle:
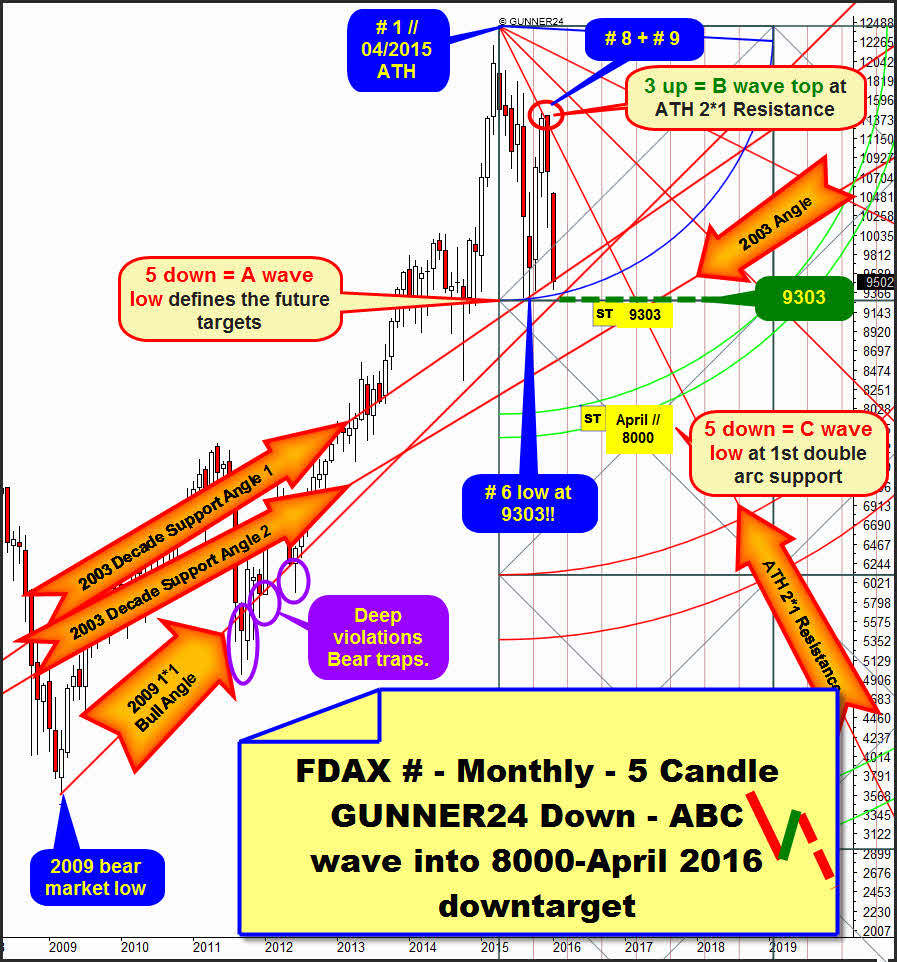
Thus, in the FDAX the situation is presenting as depicted in the chart above. The ATH was brought in on April 10, 2015 at 12430.
Important: Out of the three markets analyzed today, the FDAX was the VERY FIRST one to top out. The ES and the YM topped out closely afterwards in the month of May 2015.
The first low after the ATH was made with the August 2015 low at 9301. Thus, for the first wave we count down 5 months, beginning with the month of the attained ATH, thereby the Blue Arc is also traced down to the low of # 5. This counting of the initial down impulse is absolutely confirmed because at the low being # 6, September 2015 tested successfully at 9303 exactly, the first square line support that resulted automatically.
Beginning at the low of # 6, we count then three candles till at the ATH 2*1 Resistance Angle the first important lower high of the correction was marked with the monthly high of November 2015 = # 8. The importance respecting the elemental ATH resistance function of the 2*1 Angle is confirmed because the FDAX is now being passed downwards without brakes by the beginning of the first December 2015 (# 9) trade.
So, we count clean 5 (Fib number) first initial down impulses. Then clean 3 (Fib number) months of countertrend. Currently, in January 2016 the market is therewith in the 10th month of its correction.
==> The sequence first wave 5 months down = significant low of the correction. Followed by 2nd wave 3 months up = significant high of the correction results in 5 + 3 = 8 (Fib number), followed by a powerful downwards thrust that had started at the # 8-high, followed by the open gap on yearly base, clearly indicating that the next important turning point cannot be due before the 13 (Fib number) = 5 + 3 + 5.
==> So the market is situated in an ABC correction having been A = 5 down, B = 3 up and thereby C again should have to comprise 5 months down.
==> Thus, technically the FDAX will not be able to finish its current C wave before April 2016!
==> At the same time, the C-wave low in April 2016 would thereby be able to end the current down cycle precisely after 1 year. ATH in April 2015. End of the current correction to be expected in April 2016 then.
==> Before we go into the likely target of the C wave to be expected at the 1st double arc support at 8000, still a brief assessment on the present sell-off situation.
Eying the Blue Arc above as well as the first square line and additionally the 1*1 Support Angle that springs from the important bear market low of the year 2009 = 2009 1*1 Bull Market Angle, we see that these 3 important supports take their courses for January 2016 exactly at 9300. Therewith, the 9300 is not only important attraction point and down magnet for the price, but also extremely important support on monthly and yearly base for the FDAX. So, actually 9300 should laxly have to be achievable for the current January sell-off.
Whether or not the 9300 will withstand in January is still in the stars of course. By all means, a January resp. February 2016 close below 9280 (means a close below combined 2003 Decade Support Angle 1 + Blue Arc support + first square line support) will be a super powerful sell signal in the monthly time frame. That makes the 8000 sure to be worked off till April 2016 with a 100% of probability.
Normally, the 9300 is such a strong support that from there at least a bounce during 2-6 week may and can start that is supposed to go newly up to an important ATH resistance. A thoroughly possible bounce is likely to reach once more the 10200-10500!!
A very first weekly close below the 9280 still in January – quite possible for next week – would activate a 2003 Decade Support Angle 2 to be reached rather swiftly either still in January and/or in February. For January 2016, the 2003 Decade Support Angle 2 takes its course exactly at 8500. For February, the 2003 Decade Support Angle 2 takes its course at 8520!
Likely FDAX downtarget of the C wave
For the old readers to polish up and for all those good many new recipients of the free forecasts here’s something fundamental concerning GUNNER24 Down Setups:
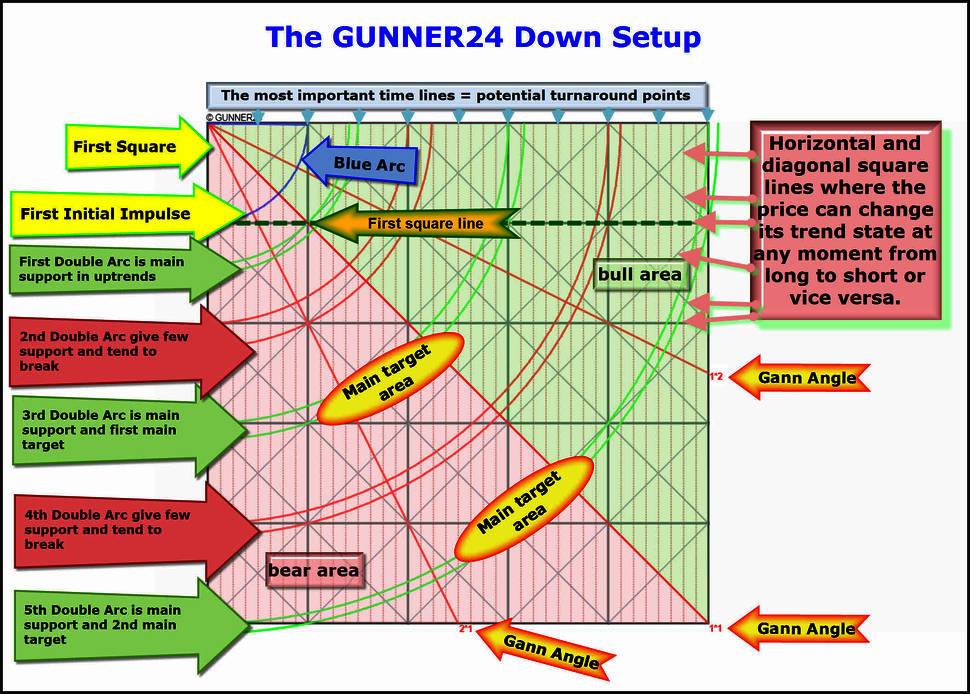
Above, you see the ever same buildup of a GUNNER24 Down Setup with the meaningful color sequence of the 5 GUNNER24 Double Arcs. The individual double arcs are always the natural targets that result from the first initial down impulse being activated correspondingly as soon as the first square on closing base is being left downwards.
GUNNER24 Down Setups can be applied in any time frame in order to determine natural consolidation targets resp. downtrend targets.
Broadly speaking, the space between top and bottom threshold of the first square always marks the consolidation area after the important top. If the market after the consolidation period turns up again still within the first square resp. from the first square line, it will only have delivered a consolidation, thereby just showing the very strongest possible, trend-confirming behaviour.
"A very normal correction in the uptrend = strong trend-confirming behaviour" can be labeled afterwards, if the correction ended at the 1st double arc. Th e 1st double arc is always main support of an uptrend often being worked off/reached within simple ABC-wave structure resp. the somehow more complex ABCDE-triangles.
A full-fledged correction is present when the 2nd double arc is reached. Especially the stock markets don’t like at all to turn up again there finally, but the commodities frequently do. If the 1st double arc cannot be defended the stock markets tend to reach and work off the 3rd double arcs within corrections. Therefore, the 1st as well as the 3rd double arc are main supports concerning stock market bulls!!
Well, it’s always matter of the observer’s/investor’s/trader’s assessment what should follow after the confirmed break of the first square line horizontal support. Is it the 1st or 3rd double arc as main target for the correction move that began with the ATHs????!!!!
Thus, we come to the analysis of the monthly YM (Dow Jones E-mini future) and the monthly ES (E-mini S&P 500 future) that in unison put out April 2016 as the next important low cycle! Namely likewise at the upper line of the 1st double arc support in the respective 5 Candle down setup.
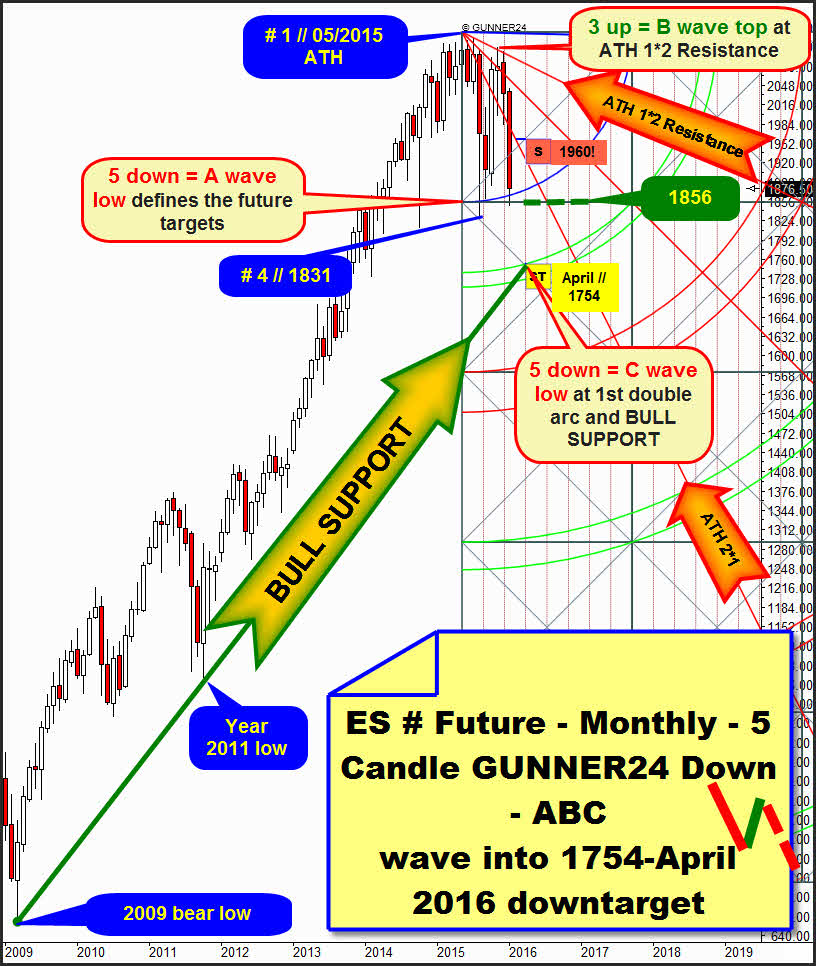
This is simple. If the ES reflects the FDAX – at least it seems to do so as far as the A-wave and B-wave counting is concerned – the 13th month of the correction will likewise be April 2016.
The A-wave ends at the low of # 5!!! I think that the low of # 4 (1831) was an irregular low, an overnight extremum!!! – followed by a 3 month countertrend into the November 2015 high, attained this time at the 1*2 Angle Resistance = ATH 1*2 Resistance = 5 + 3 = 8.
For April 2016 (# 13), the monstrous BULL SUPPORT intersects the upper line of the 1st double arc support at 1754! The BULL SUPPORT starts at the 2009 bear low being successfully tested for the first time at the final year 2011 low. Thereby, till April 2016, only just the second test of this important secular bull market support seems to be due. As is known, such important supports don’t use to break at the second test, but at the contrary, they newly unleash mighty upwards thrusts!
==> Technically, the in unison with the FDAX, the ES should have to turn up again after the completed ABC correction in April 2016 continuing its bull market, namely from the upper line of the 1st at the 1754 surroundings.
==> Since the absolute low of the first move after the ATH is at the low of # 4 (1831) and since a good = strong bounce from the 1856 first square line ensued on Friday and 1856 first square line was defended on weekly closing base, it’s quite possible that the ES will be able to defend the certainly strong monthly support zone 1831-1856 in the course of next week!!!
==> … then ditto starting a bounce during 2-6 weeks. This countertrend in the daily and weekly time frames are supposed to go at least into the ATH 2*1 Resistance Angle area! This likewise very important ATH Resistance Angle takes course at 1960 for February 2016. Then and there go short mightily if reached!!!!! for the 1754 ABC-wave downtarget.
==> Last week’s low is at 1849.25. ONLY a weekly close below that would activate the upper line of the 1st double arc to be reached very quickly!
==> Each weekly close below the 1856 monthly first square line will finally confirm the upper line of the 1st and the 1754 ABC-wave downtarget to be reached.
Last but not least, yet to the YM continuous contract now. Because of the BULL SUPPORT that exists there, it is really always worth wile considering and analyzing the future markets as well. As its most important BULL SUPPORT, the YM uses an arc that springs from the 2009 bear low:
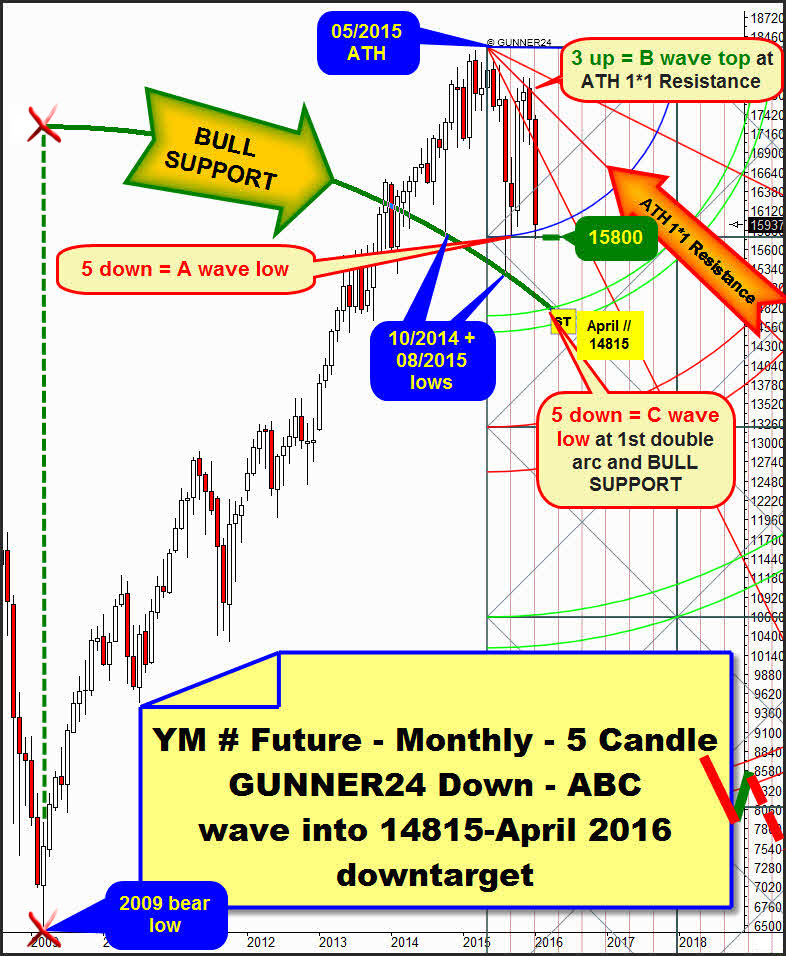
Originally, this arc is a GUNNER24 Arc existing in the currently determining monthly up setup. For better general view and comprehension, I refrained from illustrating the valid up setup. Therefore, the BULL SUPPORT is in the chart by itself and concentrated!
The BULL SUPPORT was defined with the important October 2014 low and the important lower low of August 2015. The BULL SUPPORT arc intersects the upper line of the 1st support at 14815 in April 2016.
==> Since BULL SUPPORT can originally be derived from the 2009 bear low having been tested successfully in 2014 as well as in 2015, it is an important, possibly the most important support for 2016 = support arc on yearly base.
==> Also in case of the YM, we can so far count 5 months down, followed by 3 months up! At the possible C-wave low – in April 2016 = # 13 – at the upper line of the 1st, this BULL SUPPORT might be tested back once more. There and then, the current correction in the monthly time frame is technically supposed to come to its final end after having lasted about 1 year.
Be a part of our exclusive sworn GUNNER24 Trader Community – now... I try to protect your wealth!
- with daily trades – quick, safe and profitable…
- in well-chosen precious metals, commodities, indexes, currencies and in the best stocks worldwide...
- in both rising and falling markets…
- with little use of capital…

Click the button below and order the GUNNER24 Trade of the Day - $49.90 US a month.
 |
Be prepared!
Eduard Altmann