
Welcome to the first GUNNER24 Forecast in the New Year. For evaluating the present US stock market uptrend and the pending intermediate highs in the US Stock markets, for some time I´ve been zeroing on the NASDAQ-100. By its performance, its structure and its signals, it - still - provides us the most valuable indications to what is to come and above all, when the next multi-week/multi-month correction in the overall bull market is supposed to start.
In the free GUNNER24 Forecasts of 11/27/2016 "NASDAQ-100: 5000, here we come" I last went most intensely into the imminent bullish NASDAQ-100 developments.
Among others, this is what I summarized then:
==> "... the final highs of the current rally move won´t be due before December, at the earliest - 10% outcome. Yet the uptrend highs are much, much more likely to be expected by mid-January through the beginning of February 2017."
==> Correspondingly, on 11/27/2016 this monthly GUNNER24 Up Setup of the NASDAQ-100 presented itself as follows:
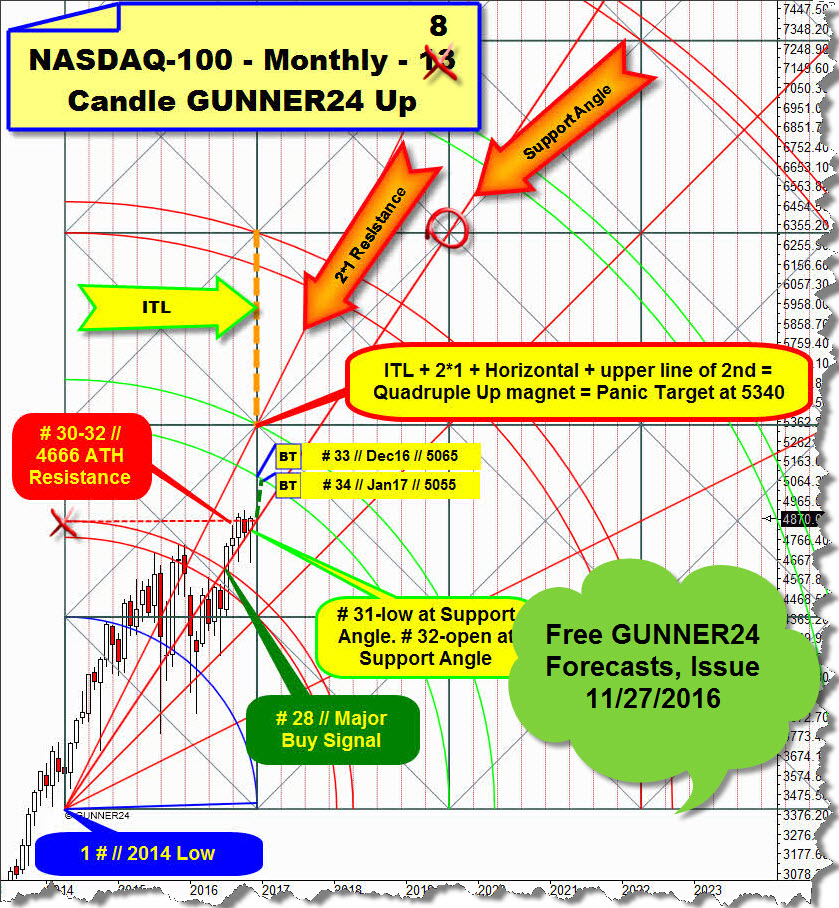
In the monthly chart of the NASDAQ-100 above, you see the valid GUNNER24 Up Setup that came up after the final low of the year 2014 (# 1). This upmove during the very first 8 candles that emerged after the final low of the year 2014 had been reached determining predominantly the course of the past couple of years.
The last important change for the index was the Brexit low, reached at the low of the 27th month of the uptrend. For the first time, this low tested the very most important bull market support, the 1*1 Gann Angle. With the successful first test of the 1*1 Angle, enormous bullish forces were released continuing with the high close of # 28. The 28th candle of the uptrend close far above the 1st double arc resistance environment that still provided resistance in the yearly time frame then. By its close above the first double arc, # 28 activated the lower line of the 2nd double arc in trend direction as the next important uptarget for this bull market.
==> The lower line of the 2nd is activated uptarget for this bull!
The lower line of the 2nd double arc is main target for the bull run!
Its being worked off will HAVE TO!! ensue now in January 2017. Thus, the index will reach and thereby have worked off its critical topping area at 5055-5065 in January. Accordingly, after the 5055-5065 main target being worked off, there will be an 85% chance for the index to correct afterwards at least by a 7%, but rather by a 10% till the beginning of March 2017. Update of the monthly setup:
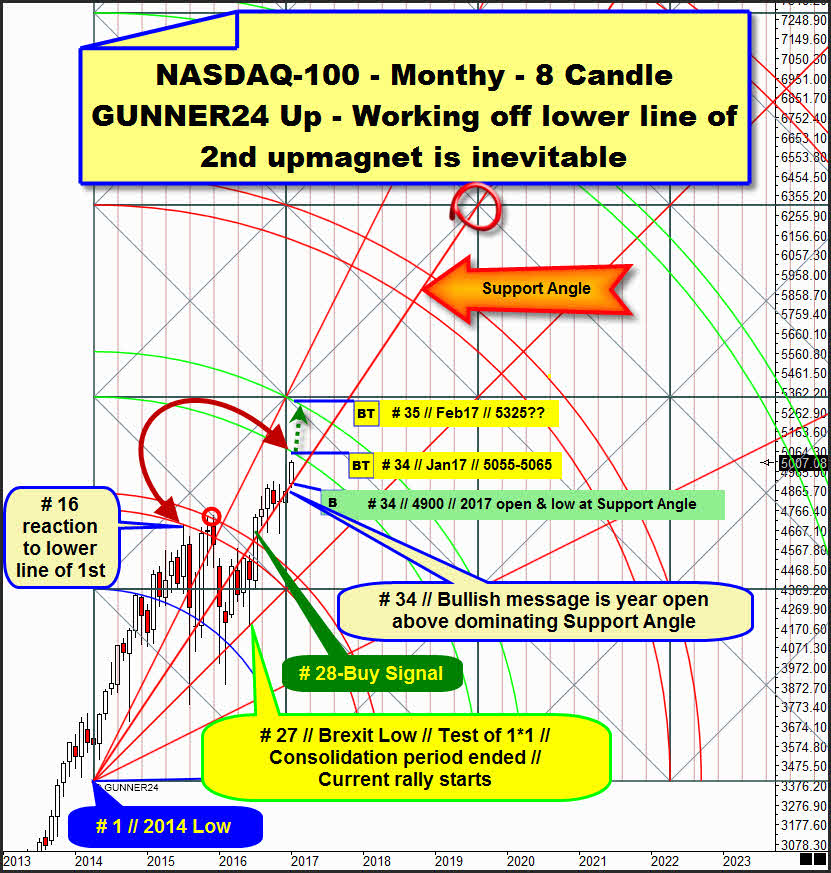
Why will the index have to reach the 5055-5065 at the lower line of the 2nd double arc in the course of January? For this, please consider with me both the closing comportment of the December 2016 candle (= # 33) and the opening of the current 2017 candle being now the 34th of the bull market.
==> The December 2016 closed very narrowly above the anchored Support Angle. This one has been the dominating support for the rally after the 1st double arc (with the # 28-close) was overcome. Every month since the # 28-close has terminated above the anchored Support Angle.
After the # 33-December 2016 scarcely succeeded in defending once more the Support Angle on monthly closing base besides the current # 34 candle featuring its open above the Support Angle, now it seems that with the turn of the month and the year another strong bull market thrust was triggered by the existing powerful Support Angle endorsement.
Since the December 2016 close, within just 4!!! trading days January succeeded in booming by as many as 150 points. That’s quite a mighty strong upwards thrust. High price rises are being put into effect very rapidly. This condition was certainly triggered by the turn of the year.
==> Technically, that can only mean this: The lower line of the 2nd main uptarget will be reached now very fast now, with a 99.99% of probability as early as in January 2017! Its attraction force is simply being too strong for the market. The distance of the index from it is only just one percent. So, it has to get there! Why afterwards a sharp price correction of a 7% to 10% is supposed to start – the reason stems from the past:
Since the lines of the GUNNER24 Double Arcs are always in a natural context and because the lower line of the 1st – then being an active main target for the bull market – triggered a sharp correction move in the bull market at the # 16-important top, there is a good chance for the lower line of the 2nd of releasing an equal resp. similar reaction.
… certainly, your eyes don’t miss the fact that the correction from the # 16-important top till the # 17-important low was the very sharpest = deepest price correction of the entire bull market!!!
# 16-important top at 4694 pts. # 17-important low at 3787 pts = 907 pts sharp correction = -19.32% correction move within as few as two month candles!
==> So, after the 5055-5065 in the NASDAQ-100 being worked off in JANUARY 2017, there is EXTREME menace of correction! Not only for the NASDAQ-100 but of course for all the other Western stock indexes as well!
Back to the monthly chart above. Let’s just go into the sketched green dotted angle rise up to 5325 pts for the # 35 month of the bull market = February 2017.
We presume that the turn of the year triggered a next strong rally thrust that will have to work off at least the 5055-5065 in January 2017.
==> 5055-5065 = main GUNNER24 Arc Target for the 34th month of the bull.
As you know, 34 is an important high Fib number, thereby it’s predestined for getting an important top resp. for an important change in trend. If the 5055-5065 being the next main resistance + main target of this bull run succeeded in being overcome sustainably, as to the GUNNER24 Body of Rules the upper line of the 2nd will be activated as next uptarget for this bull market!
Thus – if January 2017 closes above about 5080 – actually… because of the identified new strong upforces certainly released by the turn of the year – February 2017 will be supposed to be able to enforce the upper line of the 2nd to be worked off = 5325 since then 34 months of uptrend candles AFTER the achieved 2014 low candle would be countable.
==> in the monthly chart above, for the current uptrend month # 34 I marked the best cause most riskless monthly long-entry into the 5055-5065 main uptarget at the anchored Support Angle and at 4900 pts. I’m afraid, that rather the sky falls on our heads than the NASDAQ-100 will see once more the 4900 resp. the Support Angle before the 5055-5065 will have been worked off.
Therefore, to conclude today’s forecasts, let’s take a look at the weekly time frame and the determining GUNNER24 Up Setup. I think, at 4964 pts for the next trading week and the one after next there’s be a good pullback-support that can be used for an entry into the last Hurrah up to 5055-5065 main target:
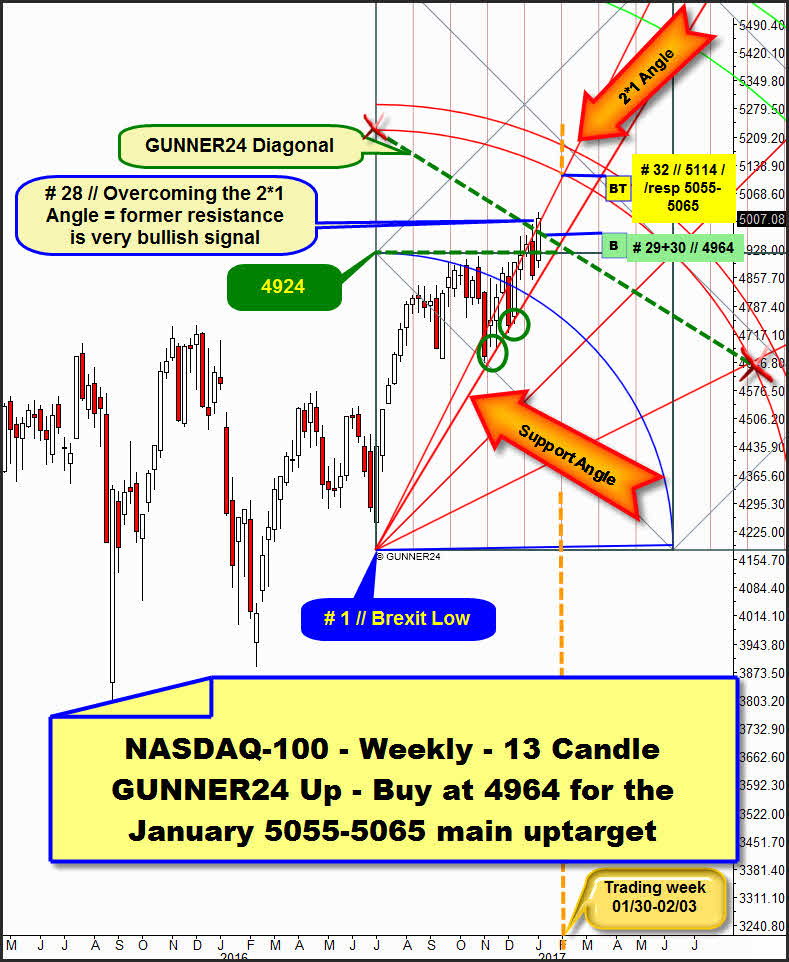
Above, you see the currently most determining GUNNER24 Market Setup in the weekly time frame. It's a 13 Candle up that begins at the attained Brexit low (# 1).
After the end of the 13 week initial up impulse, the market started topping out resp. swinging into a sideways phase tested the Support Angle at the green ovals most intensely. The Support Angle forced the market into a series of higher lows, and the 2016 uptrend had to be resumed. After the long-lasting resistance of the Blue Arc could be taken, the market succeeded in delivering a weekly closing price above the 4924 first square line in December 2016. Ultimately, with the uptrend week # 27 the year closed again below the 4924 first square line.
Because of the newly started upforces triggered by the turn of the year, last week – the first week in 2017 = # 28 – closed far above the first square line. This is a mightily strong new GUNNER24 Buy Signal in the weekly time frame that activated the lower line of the 1st double arc as next important upmagnet in trend direction!
A sign of the present force is the fact that the NASDAQ-100 was able to close # 28 still above the 2*1 Angle. Thereby, # 28 was a double GUNNER24 Buy Candle. By virtue of this most recent double GUNNER24 Buy Candle, I see the weekly time frame currently as bullish as the monthly chart. There’s really no high probability for the index to show a strong pullback once more before the 5055-5065 monthly main target will have been worked off. Thereby, a classical pullback into the first square line support in January is nearly to be ruled out.
There’s a GUNNER24 Support Diagonal that takes its course at 4964 pts for the next trading week and the one after next - = # 29 + # 30. I think a rather strong support is there that can be used for the long entry into the 5055-5065 upleg!
Interesting is a now identifiable weekly upmagnet that results from the intersection point of the just re-conquered 2*1 Angle and the now finally activated lower line of the 1st resistance double arc. For the trading week 01/30 to 02/03 it is at 5114 pts. To me, first of all that means that the whole uptrend might last until just this term. Whether or not the 5114 pts can be reached at the lower line of the 1st upmagnet until that term is very doubtful for the time being since the 5055-5065 represents major resistance in the monthly time frame after all!
== > I think that January 2017 might newly become a classical uptrend month, with an attained monthly low on the first trading day of the month and its monthly high reached on the last trading day. Correspondingly, the expected sharp 7%-10% correction move might begin at the first February trading day…
Be prepared!
Eduard Altmann