
Is it really that simple? The important US indexes performing important highs on 12/31, the S&P 500 finishing 2013 even one point below the all-time highs, both precious metals producing important lows the same day of the year 2013. At the first trading day of 2014, both metals started to rise all of a sudden, whereas the US indexes begin to weaken distinctively.
It seems to me too obvious that the money managers, hedge and index funds start to reallocate their means like at the touch of a button. I ask myself whether they use the same algos? Or are they all in the same mailing list having for long the plan on the agenda that reads about like this: "Punctually at year-end we let the metals fall, letting in return the stocks rise to the maximum yearly high, thus making the most of our market power and polishing our 2013 performance infinitely. And in January we fake the investors profoundly letting the precious metals rise and the stocks fall…"?
The way the guys arrange things doesn’t matter to me ultimately. Why should I care, the press and the fellow analysts like to call that window dressing or tax window dressing, respectively. I call it fu***** around the folks. I think, formerly the markets used to be in a better way, because better lined up. Many more market participants made the prices. By the narrow nexus with banks, between banks and funds, and with states, nowadays at once there are some mighty players with too much market power = too many readies distributed between few registers so they can – let’s say it outright – manipulate the markets as they want.
Well, all we got to do is keep on measuring when and where things turn, and it works like this (but anyway, I’m allowed to get uptight, am I not??):
Since the middle of 2013, gold has been following the cycle 2011-2012. Beginning at the June 2013 lows, it has reflected its 2 year rhythm just perfectly, as it were. The turning points can be cleared away almost completely, i.e. with maximally 5 day intervals. I visualized that state with the dotted orange verticals:
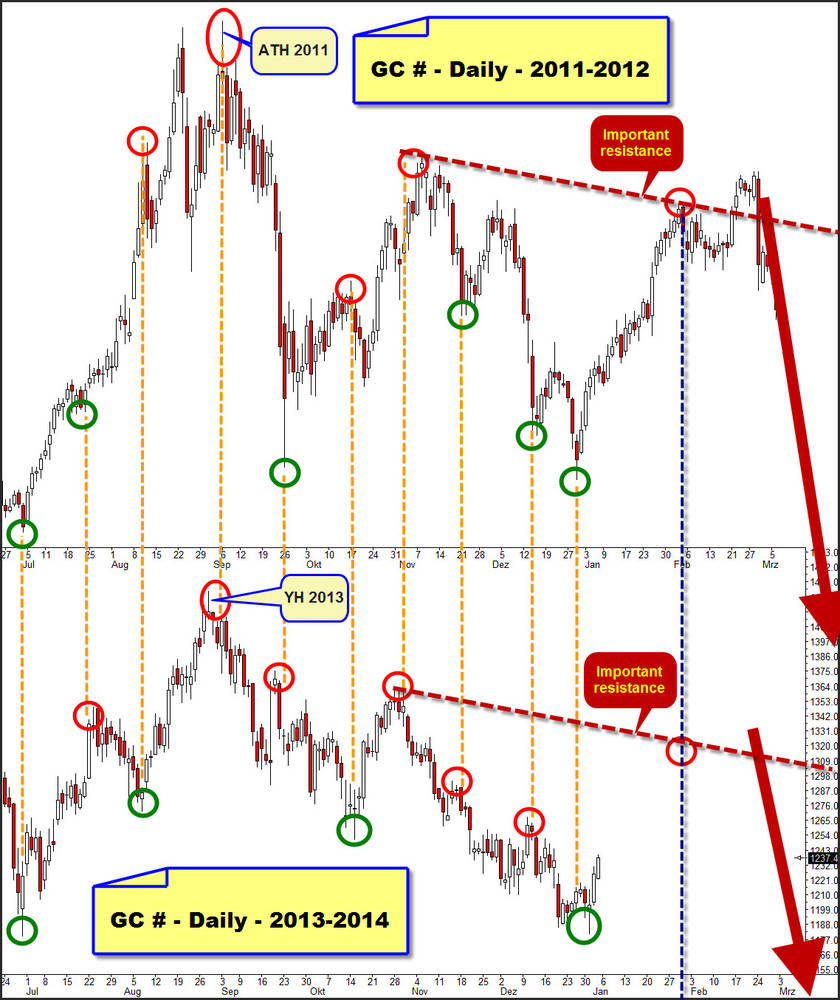
In such a consideration it is not really important whether a low of 2013 matches exactly a low of 2011 or a high of 2011 matches a high of 2013. It’s just about the factor time, I mean the moment when the price turns again.
But what makes us conclude from that gold finally achieved to turn is the fact that always substantial changes in trend followed whenever the red and green marks (red = resistance and green = support) are completely congruent. Ergo and the conclusion is this: the 12/13/2013 lows are a final downtrend low. A new uptrend has begun!
By the presented up-energy since the 12/31 lows gold managed to generate a GUNNER24 Buy Signal on weekly base. In addition and in chart-technically view it produced the first weekly reversal candle since 3 months. Furthermore, by the powerful rise of the past days the monthly 1205 GUNNER24 as well as – even much more important – the monthly horizontal 1222 GUNNER24 Magnet was re-conquered. That indicates that there is very much up-energy which is likely to prevail/hold on several of weeks. Since the current lows goes cyclically fine with a turning point from 2011, the next move is supposed to be upwards now.
If gold also in 2014 wants to follow its 2 year cycle pattern, till end of January it is going to rise generally without considerable resistance. If it wants to perform – we only mind the price component now– about the way it did at the beginning of 2012, it will rise exactly to the 1322 GUNNER24 Magnet. This target area arises transferring the red trendline from 2011/2012 to the last important top of the year 2013 with the same angle and length.
From the end of January through middle of February gold (and silver) should start falling again reaching new correction lows by June 2014, about 1050$.
The just started upswing can only be a matter of a daily countertrend in the weekly and monthly downswing, because the volume at the lows of last week was too humble for being an elementary important low. Certainly a hefty price sell-off took place, but by far no final washout regarding the volume a la June 2013.
In these whipsaw markets of the last weeks that might confuse any trader thus leading mercilessly to burning the trading account the professional signals have got their special importance. You get them in the GUNNER24 Gold Trader!
You best register with our GUNNER24 Gold Trader now. That’s where we oversee the optimal entries and exits for you. Especially in the difficult market situations where many factors have to be considered the Gold Trader is backed by the additional GUNNER24 Signals based on the combined 1, 4 and 8 hour setups to catch the optimum entries and exits.
|

The GUNNER24 Gold Trader will provide you with the critical knowledge you need to forecast and analyse the precious metals with the GUNNER24 Forecasting Method. All the GUNNER24 Trading Signals you receive real-time are based on the actual Gold and Silver Future. The NEW GUNNER24 Gold Trader is a must for every actively working investor and trader who wants to trade successfully in everyday trading. The insights you receive from the head trader Eduard Altmann (and discoverer of the GUNNER24 Forecasting Method) are truly amazing sometimes. I promise!
Click the button below and order the GUNNER24 Gold Trader - $39.90 US a month. For 201 members and up - $49.90 US a month.
 |
Well, well, exactly this volume consideration at the current highs is the reason why the stock markets technically can’t be ready yet with their top-formations. The low holiday volume must compellingly require another approach to the tops before the markets are allowed and to turn down with confirmation. But depending on the index – you know, we regularly consider the Dow Jones, S&P 500 and NASDAQ-100 – the price top may have reached or brought in already. Just the exhaustion volume is still missing. It may be supplied later in 3 different ways.
The most classical way is a lower high on daily base. In case of a new approach to the top, the market participants recognize that there isn’t enough power any more to reach it again. So they sell plainly into this lower high and with a much higher volume than in case of the absolute top.
Much less frequent is a double top – we observe the same motivation and comportment as in the first case described above.
But classical as well is – and we normally have to expect that if the markets have a several month decline ahead – the constellation with a next higher high where the Big Boys (as sketched above in the introduction ;-)) unload their longs with a maximum volume, collective and concentrated.
... many Big Boys spent the holydays either in the Caribbean or in Mexico in well-deserved vacations. Since all the Big Boys are sitting in the same boat, all of them getting their crumbs, another attack to the highs will come. The question now is only when?
Technically there are only 2 suitable time windows for that.
It’s A) the period till 01/13/2014 indicated by the GUNNER24 Setups, especially in the S&P 500 in the weekly time frame:
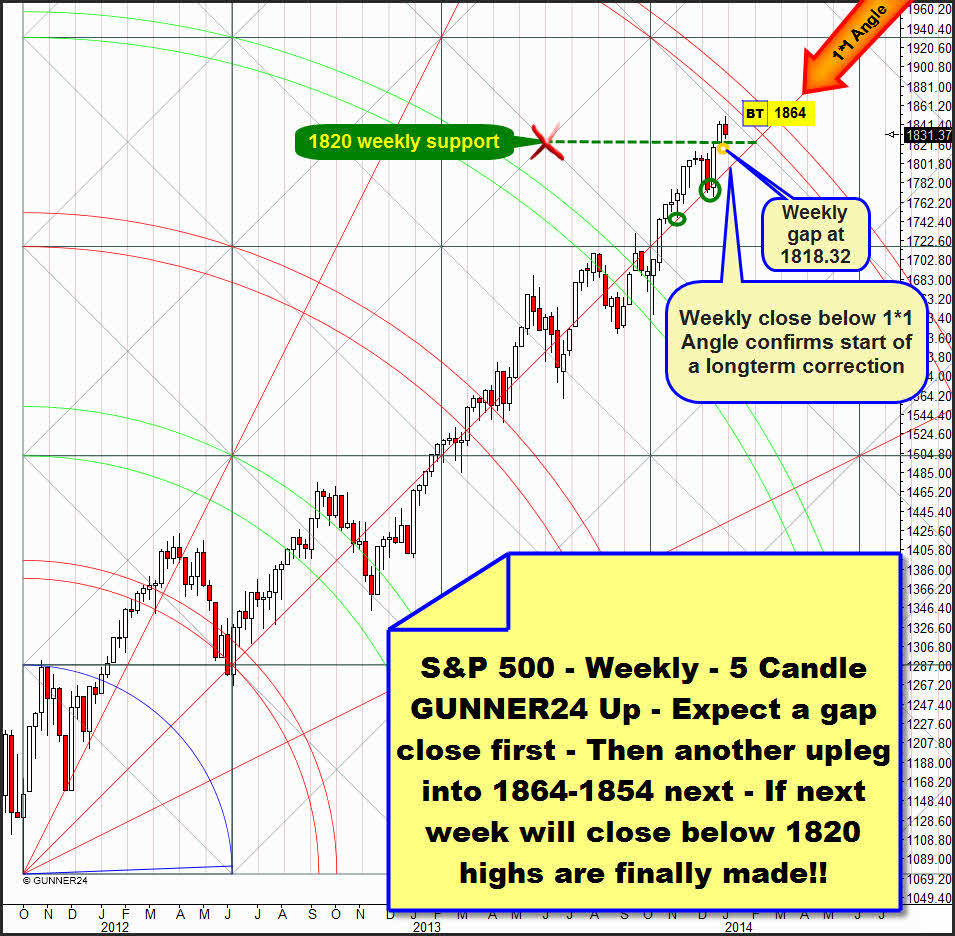
In the weekly time frame, the S&P 500 has its main target immediately ahead. The last week candle is very close to the 1864 main target already. Either next week or the week after next, the S&P 500 will reach and touch the 5th double arc. The S&P 500 seems to need urgently a little dip upwards to be able/allowed to turn down finally - after touching the 5th double arc resistance.
At 1818.34 there is a weekly opening gap that should technically be closed next week. In fact, it will be the 13th day of the current daily upswing = next Tuesday the gap close is offering itself. To remind, with Fib numbers, in a swing very often important highs/lows are marked, so with 3, 5, 8, 13 etc.. In the same go the 1820 weekly support horizontal would/shold be tested.
If this test proceeds successfully the market will be expected to run up to the 5th double arc, most heftily and quickly within 5 days. If in that case we observe an significant exhaustion volume at the 1860 region, the S&P 500 will be likely to go down then, technically.
This scenario will go to pot if next week closes beneath 1820. In that case the S&P 500 and all the other markets will fall until the end of January… what goes perfectly hand in hand with the gold forecast above, by the way!!
Or B) The test of the current highs won’t succeed before the beginning of February 2014, if the markets want to go on following the presidency cycle.
See the example Dow Jones, that in 2013 reflected in a really ideal typical way its Presidential Cycle. That’s why we’ll have to keep on tracking concentrated the ideal-typical course of the midterm election year – being the case 2014:
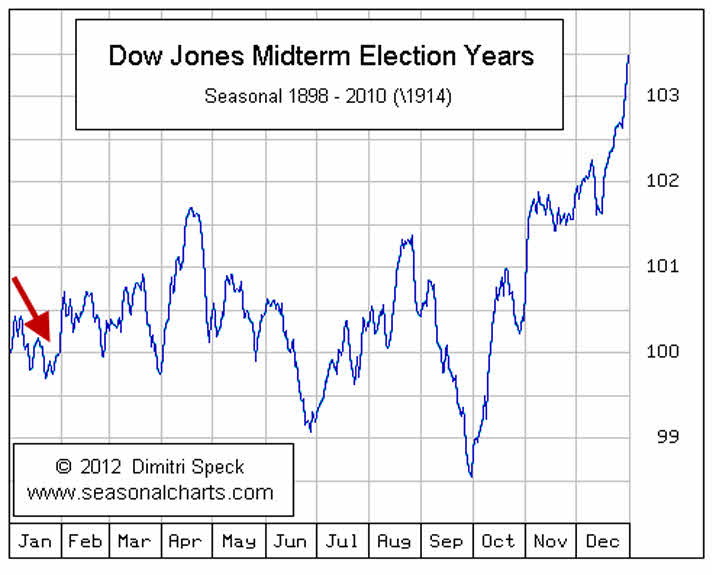
http://www.seasonalcharts.com/zyklen_wahl_dowjones_midterm.html
In seasonal view the Dow Jones may fall now into the obligatory end-January low of a midterm election year rising then and generating sporadically new highs till April.
GUNNER24 is reckoning that in January a decline during at least 6 months will start, with a correction potential of a 20%.
The Dow Jones may have made its absolute price high of this bull. In any case, there won’t be much any longer. I ask you to sell all your stocks so far! But don’t go short yet. This would take a confirmation. We, the GUNNER24 Staff, will go short as soon as the first weekly candle indicates so. Such is not the case yet!
So why has the Dow Jones come to an end? Here’s the answer:
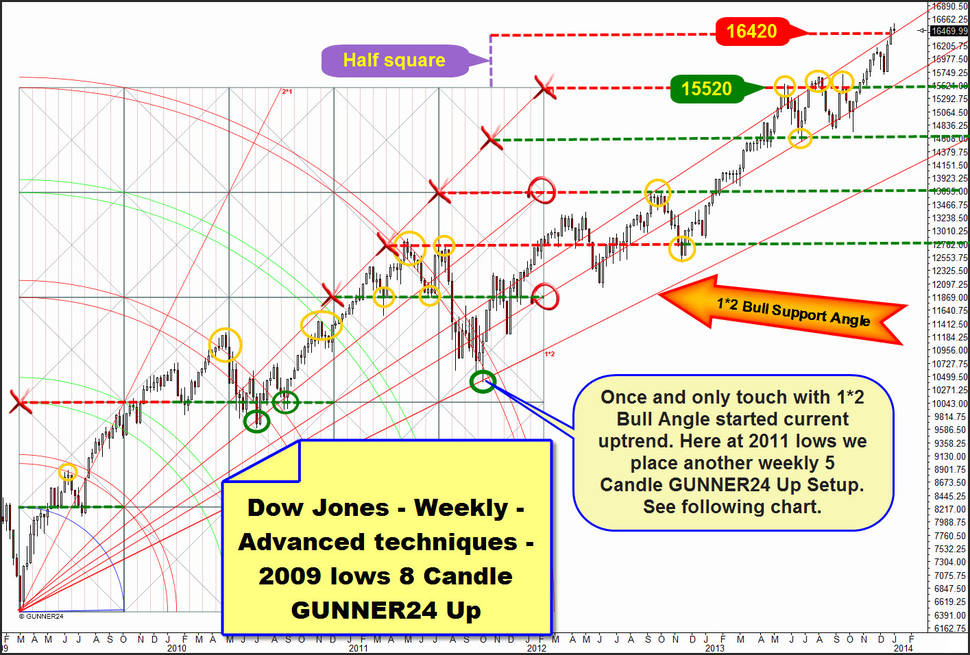
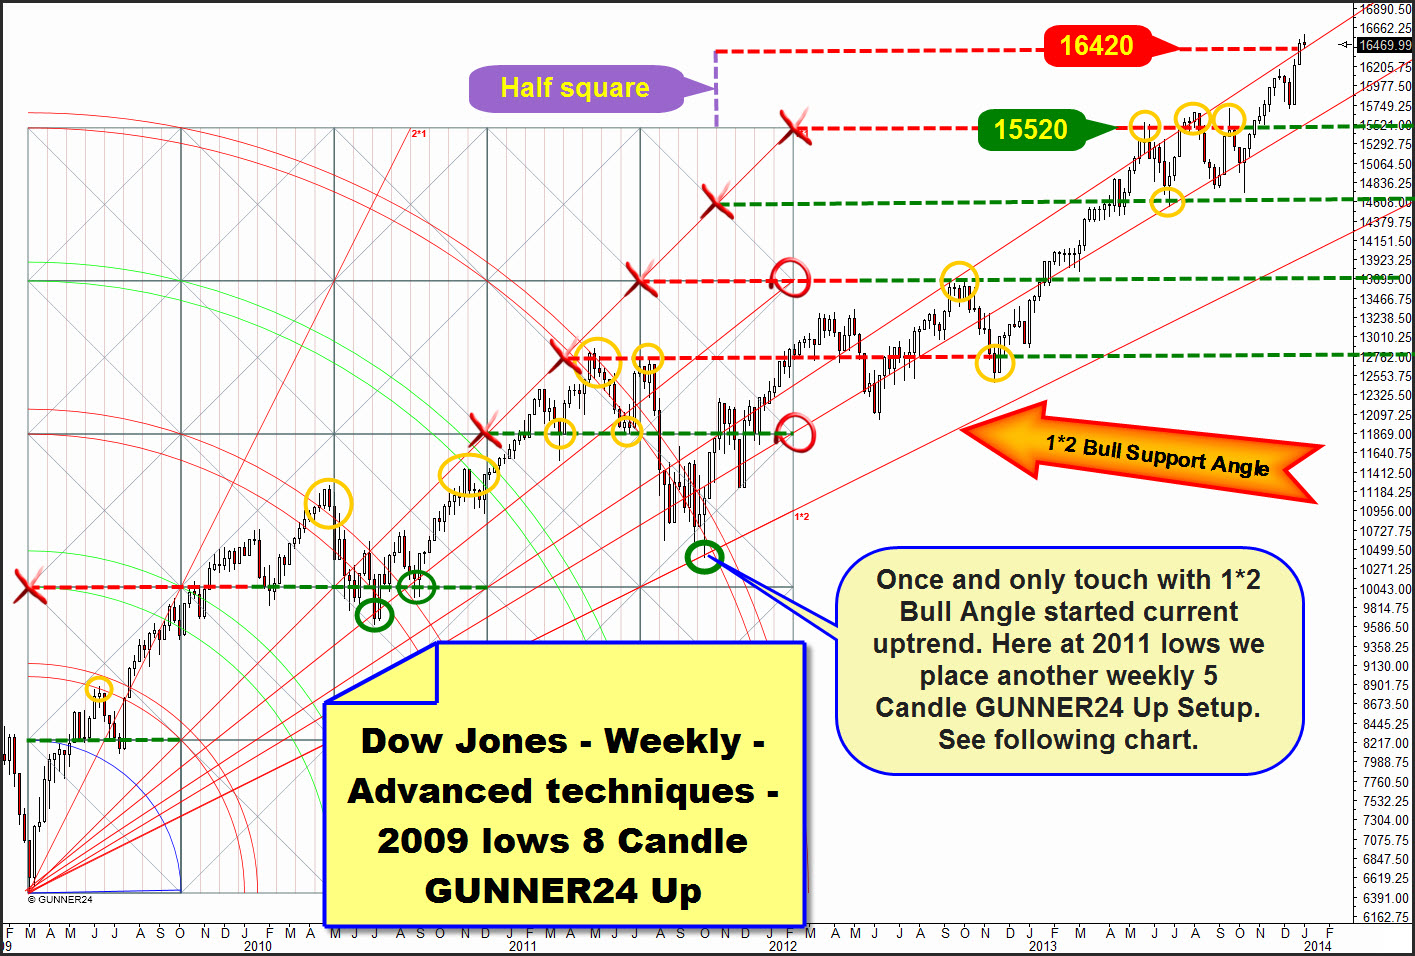
We consider the weekly time frame from the 2009 bear lows till today. From the 2009 lows an initial impulse evolved, with 8 weeks of duration, whose consequences are visible and effective until today – and many more years to come. This first initial impulse gives many very important magnets the Dow Jones is oriented and stuck to with pleasure.
Above, I marked in orange all the important reactions to significant magnets. Depending on their respective state, the horizontal magnets are either red dotted = or green dotted = support.
Even though the setup is temporally run out since the beginning of 2012, its horizontal magnets determine clearly the development of the last two years. All the important horizontals that arise from the center of a square and the different upper and lower square lines grant support or resistance respectively for the future prices.
Currently, the Dow is situated at a new powerful monthly horizontal resistance. A look at the thereunder horizontals is sufficient to realize that the current price level is good enough to start a several month decline.
Danger!! Out of the stocks, the Dow Jones isn’t well worth the effort any longer!
In the chart you see the lowest bull-support, the 1*2 Gann Angle. Only one time during the current bull this angle was touched and tested. It happened at the 2011 lows at 10405.
Since this low is situated in front of a double arc being reached an important and natural Gann Magnet and having taken place a rebound from this magnet, it’s allowed to apply there another up setup.
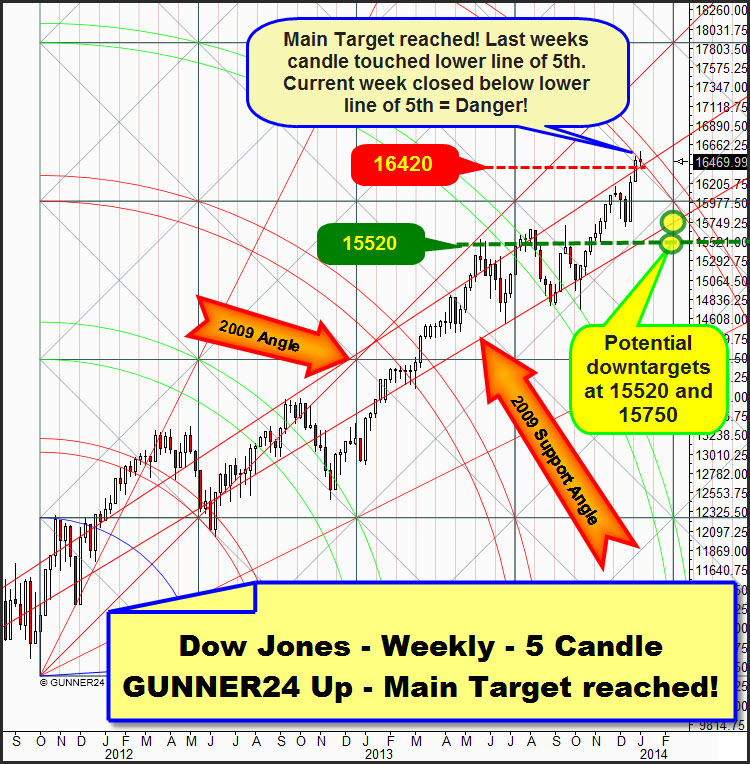
Here’s the valid weekly 5 Candle GUNNER24 Up with starting point 10405:
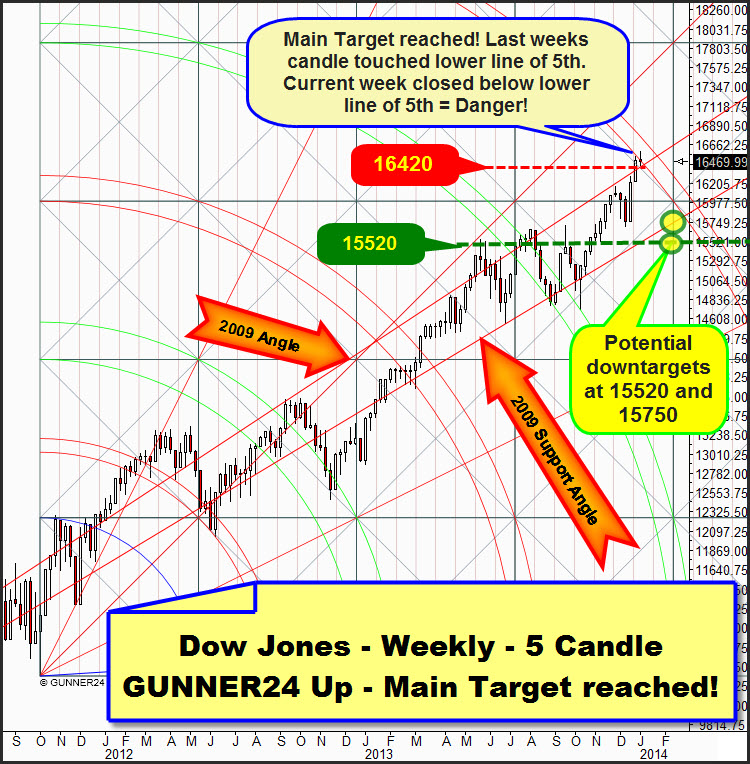
In this setup the main target is reached. The week before last, exactly the lower line of the 5th touched at the highs. This week briefly dipped into the area of both lines of the 5th, but it was retraced. Paying attention precisely to the closing price of this week we recognize that it is lying very narrowly beneath the lower line of the 5th. The market minds this resistance, this usual very powerful weekly resistance.
In every GUNNER24 Setup, the 5th double arc is a main target where we always have to reckon with a change in trend.
Both weekly setups of the Dow Jones signal the end of this bull. No matter whether 50 more points are added. Start to get rid of your stocks. You may still have a week of time for doing so. Perhaps there will be another try to head for the current highs, even to exceed them in the short term. It will be possible during the coming 6-7 trading days yet. But if the markets keep on slipping down, by the beginning of February this repeated approach will take place with a high volume. No later than that, lower lows on daily or weekly base should be the outcome!
Danger, get out of the stocks!
Here and here, for the purpose of better contemplation you may download both important weekly Dow Jones Setups in their original format.
Be prepared!
Eduard Altmann