
Welcome to the first GUNNER24 Forecasts in this new year. With the analysis of today, I would like to start a slight series, which aims to thumb the most important targets of some markets in 2015. More precisely stock markets, metals, oil, some currencies and so on. As gold has the most fans among our faithful readers and traders, I will introduce the series with it.
Where and when is the actual gold bear market period in the secular bull market likely to end? For in terms of chart technique, the current downmove since the gold all-time highs in September 2011 at 1923.70$ is still a matter of a correction in the secular bull market. Temporally as well as in terms of the price performance gold is still in the secular bull market, unambiguously.
So far, gold is still correcting its last powerfull upmove that started by the end of 2008!
The following forecast for 2015 is based on the monthly chart. The monthly chart ist most determining chart for the trend and the determination of the trend beside the annual and quarterly chart. Today I will begin with the well known 4 Candle GUNNER24 Down Setup, which has been presented and analyzed the 04/21/2013 for the first time by the GUNNER24 Forecasts.
Already back then, 1.5 years ago, we could put on record that the price of gold has to reach the 1140-1040 area during the current bear market period in the secular bull market, once a certain condition is fulfilled.
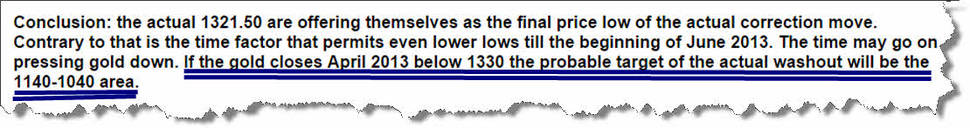
The current low in the existing monthly downtrend as is generally known stands at 1130.40$, reached on November 7, 2014. Because of the downtarget, you could say: "mission accomplished", meanwhile. However, gold will kick in the 780$-835$ in 2015, most lately in 2016 with a likelihood of 65%. With a likelihood of just 30%, gold will turn upward again substantially from the 950$-1000$ area because there it can finish the current bear market in the secular bull. Therefore, there remain 5% of likelihood that gold will record its final low of this downtrend at the 1140$-1040$ area.
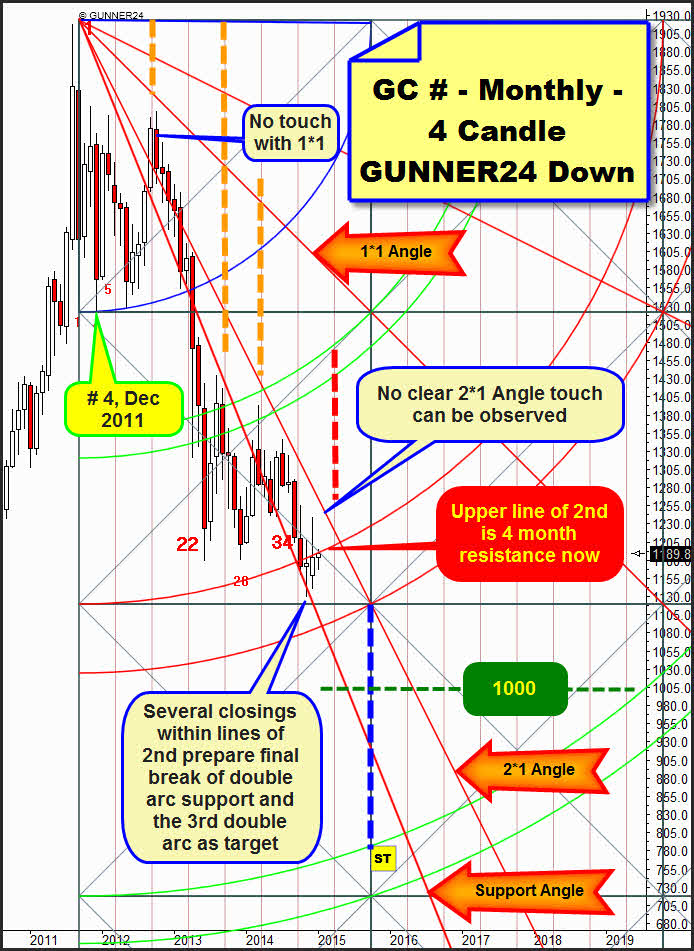
It is remarkable that we can count only 4 monthly candles from the September 2011 all-time high to the absolutely first important low of the correction (December 2011), not 1, 2, 3 or 5 months. 4 is not a Fibonacci number. Therefore, the setup is a little bit untidy. This happens in case of countertrends, it is even a characteristic of countertrends that their initial impulses do not go along with the Fibonacci series. In plain text that means that, the bulk of the market participants do not endorse the setup. In a manner of speaking they just "allow", tolerate" and "swallow" it.
To me it is strange, too, that since 2011 there has been no touch with the 1*1 Angle spotted by the market. In addition, the price behavior for the important 1*2 Angle is extremely ambiguous. We cannot see that this important magnet has been struck even once with pinpoint accuracy. Gold has been oscillating some months around the 1*2 Angle from mid-2012... Overall the market behavior for the important angles of this downtrend is really strange ==> those observations according to the important Gann Angles and Fibonacci count, help us to make an important refinement on the forecast, see the next monthly chart and the concluding analysis!
At the above setup, gold from now on has reached and processed a really important downtarget. The 2nd double arc, according to the GUNNER24 Forecasting Method the final catch point of a strong upwards trend…
==> 2nd double arcs always are important turning markers in the monthly time frame. "Extremely strong and sustainable" uptrends – as seen from the point of view of a GUNNER24 Down Setup – finally turn A) either immediately from the first square line area or B) most lately at the 1st double arc as an interception base before the market starts to turn upwards from there.
With the course of the last 3 secluded months gold has maneuvered into a really precarious position, which indicates that next gold will HAVE TO AND WILL (LIKELIHOOD: 65%!) aim at the 3rd double arc in trend direction.
==> Gold has been trading now already for totally 3 final monthly closings among the upper and the lower line of the 2nd double arc: The months of October, November and December of 2014 enclosed among the lines of the 2nd. Besides we can see that the upper line of the 2nd double arc now is confirmed resistance on monthly closing base. Therefore, in December of 2014 it is fairly accurate at the upper line BUT UNAMBIGUOUSLY BELOW the upper line of the 2nd!
==> AND as gold enclosed within the lines of the 2nd with the December close of 2014 AND THEREFORE ALSO THE COMPLETE YEAR of 2014 finished within the lines of the 2nd double arc, the following rule comes into force.
RULE: Closing prices within the lines of a double arc indicate the final break of these double arcs in trend direction.
Now it is actually quite easy. Following conclusions are the result of the upper line of the 2nd on closing base was not able to resist on monthly closing base + gold is trading within the lines of the 2nd for months without being able to gain some energy for an upwards trend.
A) The environment of the 2nd double arc develops none, more precisely just a minimum of upwards energy. The environment of the 2nd did induce absolutely none upward impulse, as it actually should be with such an important monthly support! Therefore, this development of the last 3-4 months just means a consolidation within the downtrend. So gold has to fall even lower.
B) The most likely thing to happen is that for this reason the monster support of the 2nd double arc soon will be undercut and broke down and therefore the upper line of the 3rd will become the next important target of this bear! The upper line of the 3rd stays for whole 2015 until the end of 2016 between 770 and 810. With the orange dotted marked time lines (verticals) there have been important countertrend highs in mid-2012, spring 2013 and spring 2014. Eventually gold will reflect this behavior in spring 2015 (March or April 2015) at the next reachable time line - please consider the red dotted time line -, in order to fall until the blue dotted time line into the around-800$-area in October 2015, to mark there the final low of the current bear.
C) The round 1000$-mark.
In my opinion in 2015 gold will kick in the 1000$-threshold with a likelihood of 95%. Just with a likelihood of 30% gold will enclose this bear at the 950$-1000$ environment.
The round thresholds 10, 100, 1000, 10000 and so on always are magnets for the particular markets. Often highly competitive and often multiple tested. Important thresholds. The testing of important thresholds = magnets can last months, often years and even decades.
According to gold, the topical most important barrier/threshold definitely is the 1000$. This has been tested a couple of times from below from 03/2008 to 09/2009 and was finally taken out in 09/2009. The 1000$-breakthrough triggered enormous up forces/up momentum from 09/2009, this upwards forces lead to reach the all-time highs in 09/2013.
The current problem with gold, according to the resumption of the bull is the fact, that there has been no backtest of the tremendously important 1000$-magnet until now. So without this backtest, this compulsory necessarily test, AN INTENSIVE TEST of the 1000$ gold may not reach/aim at the next higher important threshold – the 10000$. So easy!
This is why gold now HAS TO test the 1000$ sometimes. This test is to be expected in 2015. As gold soon will reach the 1000$ and has to make a backtest, correspondingly the support area, which the 2nd double arc currently delivers, will be broken and thus activates necessarily the upper line of the 3rd double arc as the next important downtarget for gold = 780$-830$!
When accessing above into the nowadays 2015-forecast I committed myself to the irregularities according to the important Gann Angles and the Fibonacci count of the topical bear markets in the secular bull.
Those irregularities and disruptive factors dissolve in pleasure when we act on the assumption that the absolutely high of September 2011 was an irregular high, so to speak a result of an exaggerated phase and exhaustion of the secular bull market. Because the high of August of the year 2011, marked at 1917.90$, is the high, which has been supported by the crowd of the market participants:
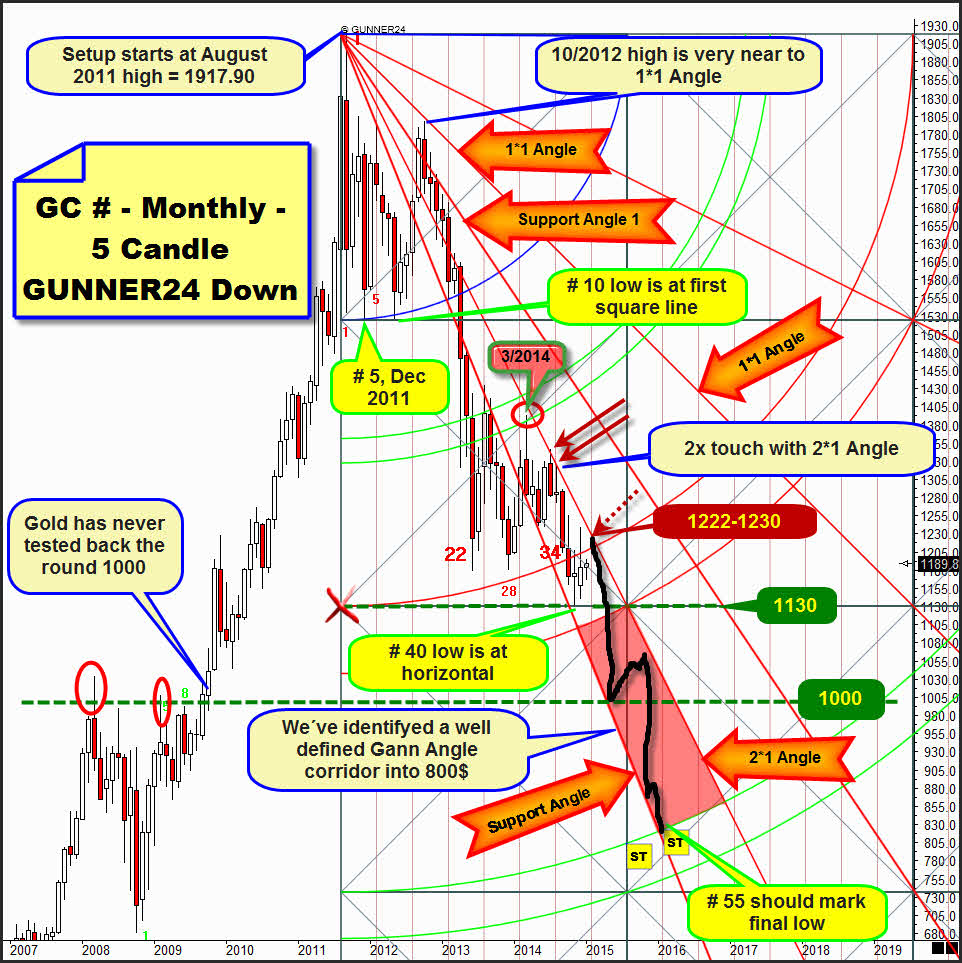
Therefore we let the down setup begin at the August high of 2011 to find out about what the mass of the market participants intended and would plan and measure until the first important low of the down movement from the all-time high environment. Thus, we can adjust a 5 month first inital impulse. 5 is a Fibonacci number. Therefore, an important disruptive factor, which counteracts an accurate forecast, is cleared for a start.
The strike accuracy, which accords to the work off of important GUNNER24 Magnets and especially of important Gann Angles, will be multiple raised. Mainly this setup leads at the same time to an enormous fine tuning according most likely target according price and time!
The low of the 10th month is precisely on the first square line. Therefore, the existence and the importance of the first square line is confirmed. After this first test of this important horizontal support, gold raised up to the important countertrend high of October 2012.
The very important countertrend high in 10/2012 lays almost exactly on the 1*1 Angle, just the power of resistance of such an important magnet can explain the following sell-off move. The sell-off, which began at the high of 10/2012 lead to the reach and breakthrough of the 1st double arc, which was tested back at the red circle. The break of the first double arc activated the 2nd double arc as the next important downtarget.
After the negative test of the 1st double arc at the red circle it went on going down until the current 1130.10$ bear market low has been worked off again accurately an important horizontal in the 40th month of the decline. It is important for us to see, that the first square line as well as the 1130-horizontal are considered. Consequently, it is confirmed that both the first square line and the 1130-horizontal are mathematically correlated. The 1130-horizontal-support now can serve us as a future signal trigger….
==> Concretely the fact that gold respects the first square line as well as the 1130-horizontal means that when gold trades for the first time BELOW 1130, it is "officially" confirmed that the run into 1000 and the following 800-area has begun. When the 1130-horizontal BREAKS at weekly closing base, the next, strong and several months lasting sell-off move begins! Lower prices than 1130 should first lead to a test of the round 1000$-threshold.
On the left of the setup now I have depicted optically, too, the problem with the round 1000$-mark. After the breakthrough of the 1000$ in 09/2009 there has been not even one test of the 1000$! This test is inescapable and necessary to trigger the raise – with a perspective for decades – to the next important higher round threshold of 10.000$.
The most important perception, which results of this setup, is the fact, that gold also considers the important 1*2 Angle and respects it as the currently most important monthly resistance. A proof are the both highs at the 1*2 labelled with the red arrows.
==> As the 1*2 Angle is the resistance, which forces the topical decline according price and time, there should begin – consider the red dotted arrow – the next strong wave of selling at the next test of the 1*2 Angle February/March 2015 at 1222-1230!
The next wave of selling – beginning at 1222-1230 (February/March 2015) – should break the 1130 and after that break the 2nd double arc support should break final and gold should reach and test the 1000. Probably, the 1000 will lead to an upward movement, to a backtest of the lower line of the 2nd! After this unsuccessful backtest of the 1030-1070-environment, there should be the next downwards movement till gold reaches and works off the upper line of the 3rd.
The current bear market low was reached in the 40th month of the bear; therefore, it is laying below the Fibonacci number 34. Thus, the 55 (+/-1 month) is activated as the next important turnaround and possible final low of this bear according time. With January of 2015 gold barely is in the 42nd month of the bear ==> because of that the upper line of the 3rd seems to have the highest attractiveness for the gold price according the Fibonacci Count and GUNNER24 Method from January to March of 2016 at round about 820$-835$.
As already mentioned above there is also the possibility that gold encloses a little bit earlier at the blue dotted important time line of this bear. The 5 Candle GUNNER24 Down drops this important time line for June 2015 and at the 800$ magnet.
Indeed, I guess, that gold will follow the Gann Angle corridor downwards, which has become visible since March 2014. In order to have a better survey of the topical dominating downwards oriented corridor, here again the 5 Candle down:
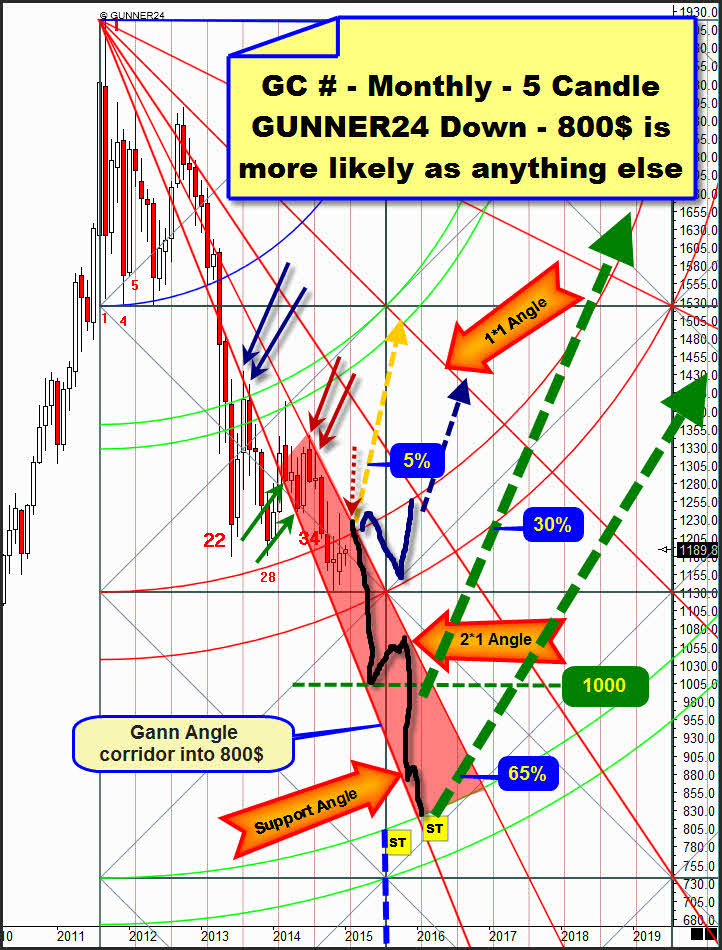
The upper limit = resistance of the corridor is built by the 1*2 Angle. The highs of July and August of 2014 (red arrows) now define this resistance. From below the Support Angle supports, which has been the resistance in mid-2013, at the blue arrows, and has been reconquered at the beginnings of 2014. In 2014 the Support Angle has been confirmed as an important support twice at the green arrows and as a limit of the corridor.
The next tangency of the 1*2 Angle will become trend-setting for gold. Actually, the next test of this angle should be applied at the red dotted arrow in February/March between 1222-1230. Count, confirmed weak 2nd double arc support and the actually owing test of 1000 indicate that the 1*2 Angle should resist again and as a consequence gold should converge unbraked and straight to the 800$ until the end of 2015. Actually, the Support Angle should hold the upcoming decline at most time in 2015.
There is the 5%-likelihood for the 2nd double arc to remain somehow and correspondingly the 1*2 Angle to be broken upwards at the next test. Therefore, there would be another test of the important 1*1 Angle upcoming.
==> Therefore, if there would be upwards pressure, the 1*2 Angle could break as a result until April 2015, because gold would reach a monthly close above 1250. This would lead to several variation possibilities for gold.
A) A monstrous upward movement until the end of the year of 2015 to the 1500$ (orange dotted arrow)! Or
B) another persistence at the 2nd double arc area for the whole year of 2015, before a sustainable upward movement starts up to the 1*1 Angle at the beginnings of 2016. Consider for this the indicated blue course, including the blue dotted arrow.
==> Those two last scenarios just have a likelihood of 5%. The 780$-830$, but especially the 1000$ are the objectives for a start, which in 2015 are first to be worked off.
==> It is certain, that after reaching and testing the 1000$ and a successful rebound of the round natural 1000$ support this whole bear might end. This is why gold will enclose this bear with a likelihood of 30% at the 950$-1000$ area.
In these whipsaw markets of the last weeks that might confuse any trader thus leading mercilessly to burning the trading account the professional signals have got their special importance. You get them in the GUNNER24 Gold Trader!
You best register with our GUNNER24 Gold Trader now. That’s where we oversee the optimal entries and exits for you. Especially in the difficult market situations where many factors have to be considered the Gold Trader is backed by the additional GUNNER24 Signals based on the combined 1, 4 and 8 hour setups to catch the optimum entries and exits.
|

The GUNNER24 Gold Trader will provide you with the critical knowledge you need to forecast and analyse the precious metals with the GUNNER24 Forecasting Method. All the GUNNER24 Trading Signals you receive real-time are based on the actual Gold and Silver Future. The NEW GUNNER24 Gold Trader is a must for every actively working investor and trader who wants to trade successfully in everyday trading. The insights you receive from the head trader Eduard Altmann (and discoverer of the GUNNER24 Forecasting Method) are truly amazing sometimes. I promise!
Click the button below and order the GUNNER24 Gold Trader - $39.90 US a month. For 201 members and up - $49.90 US a month.
 |
Be prepared!
Eduard Altmann