
Stock market overview – At the critical moment
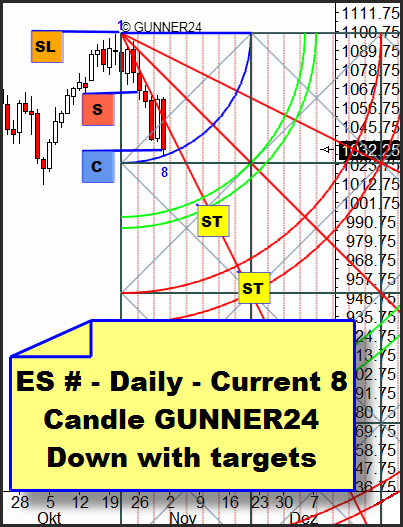
The market development of the last three days were but the most obvious ones that week. Last Monday already the sell in the new Daily GUNNER24 Down Setup happened. With Friday, we covered our shorts as the eighth candle pointed out that the swing has found almost its low.
 |
The bigger picture of the Daily ES # looks like this:
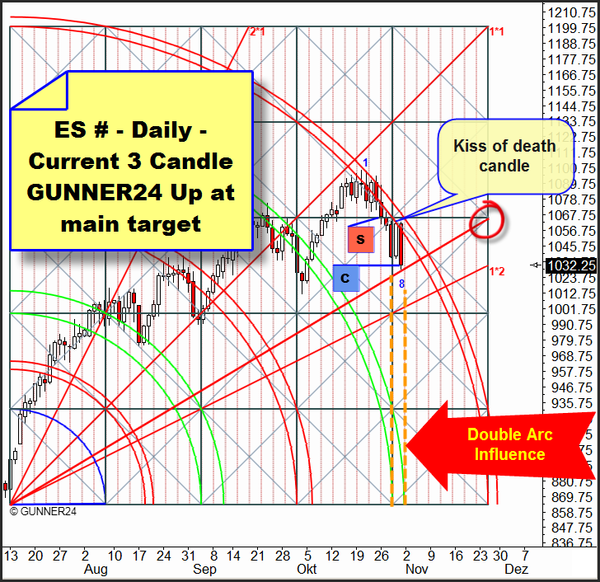 |
The situation: The price is in the bearish half of the setup and following the 5th double arc downwards. For the last 3 days, the price was in the temporal influence of the 4th double arc producing the Friday low which for many people came surprisingly. The price was supported by the Gann Angle anchored in the setup. After a short recovery, the price should continue falling. We will go short again at the waiting Gann Angle Retracement. SL at 1080.
Here, in both actual ES # Weekly GUNNER24 Up Setups we see the negative performance.
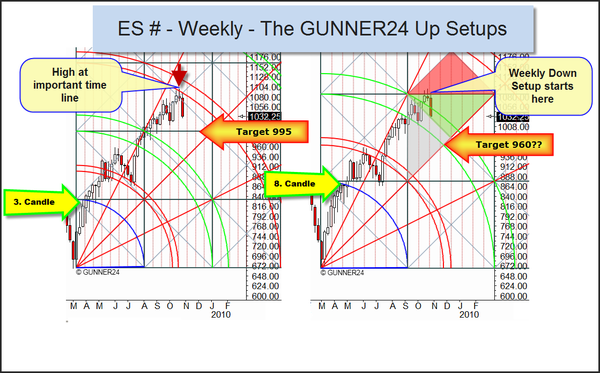 |
On weekly basis both setups reached their targets. This week, a reversal candle and a GUNNER24 Down with it has formed. The price broke down out of the Bearish Rising Wedge Pattern (not illustrated in the charts). You see the longer term down targets in the charts. They are corresponding with the new Daily GUNNER24 Down Setup and would NOT endanger the long-term upwards trend.
This is what we realize in the 8 Candle GUNNER24 Up: With the Friday low, the price is stopped at the diagonal square line which in case of its break assures a quick price submerging.
This is what we realize in both GUNNER24 Ups: In both setups the price is in the 3rd passed square what seems to indicate a longer-term change in trend.
Let's have a look at the longer-term time frames at the INDU and NDX:
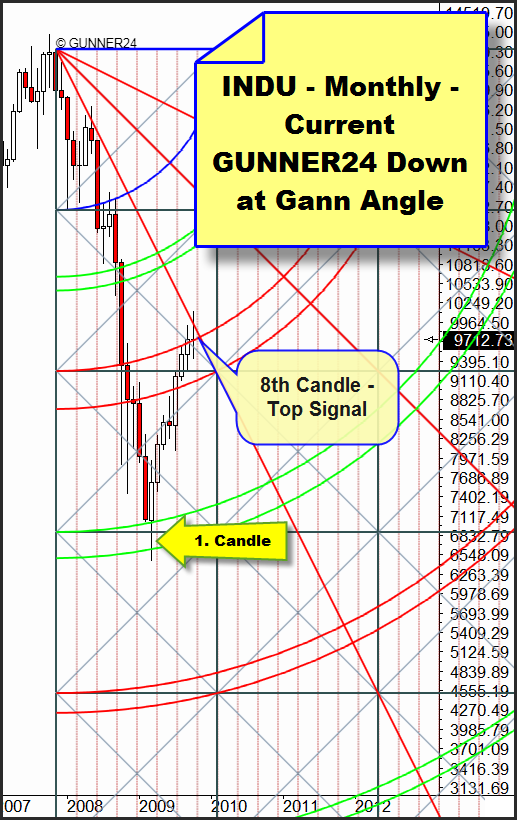 |
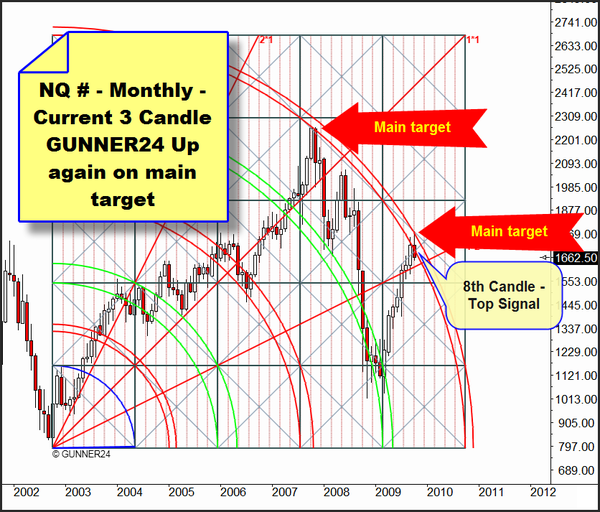
The Dow Jones is braked by the 2*1 Gann Angle. The October is the 8th up candle. We are having a Doji Star. The Doji signal is one of the most predominant reversal indicators. Accordingly, we will have to be prepared for a stronger retracement.
 |
The same applies to the NDX. To aggravate the situation, we are at the main target again. A positive sign is the recapture of the 1*2 Gann Angle which might only be tested back also because the price is in the support zone.
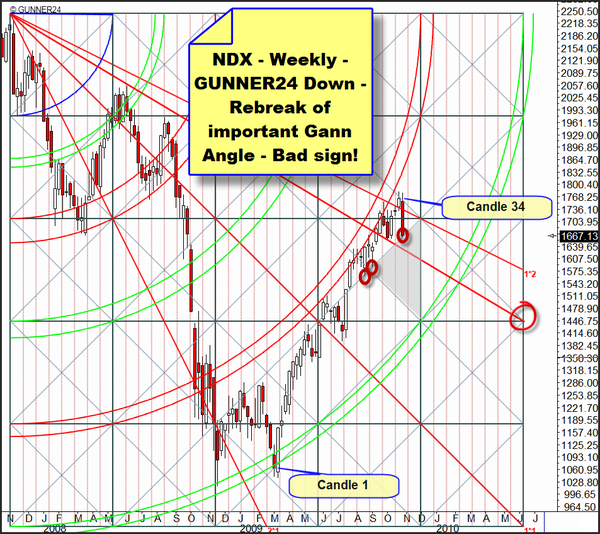 |
In the original Weekly GUNNER24 Down from 2008 "still" and again the price stops at the diagonal square line which indicates the trend in price and time (red marks).
Red Alert I: 34th candle!
Red Alert II: the price broke down out of the Bearish Rising Wedge Pattern (not illustrated in the chart).
Red Alert III: rebreak of the 1*2 Gann Angle.
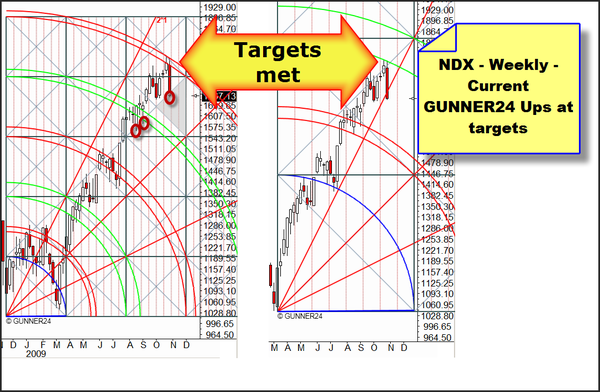 |
In the left Weekly GUNNER24 Up from 2008 as well the price "still" and again stops at the diagonal square line which indicates the trend in price and time (red marks).
In merely technical respect, actually now there are just 2 alternatives:
1. The long-term supports in the weekly charts resist and the markets ignore the mainly negative technical signals ringing in the rebound on Monday/Tuesday which in the daily ES # breaks the 5th double arc, so a daily final price above 1080. By the way that course is backed by the monthly and weekly GUNNER24 Setups in gold, copper and EUR/USD.
2. The forecasts of the monthly and daily GUNNER24 Setups are dominating and that’s my final outcome.
My advice for daytraders and swing traders: its time to short the market! This means that shorting rallies makes the most sense and avoiding getting involved with one to two day up swings. Hopefully we get next week a backtest of the broken weekly Bearish Rising Wedges to short the stock markets.
My advice for long term investors: if we close below 1023 use rallies to lighten any longs!
All the best!
Eduard Altmann